The AI-native SDLC
An agentic software-delivery pipeline I built for my own studio: ticket to merged PR, mostly driven by AI agents, with a dashboard tracking every run.
The problem
Autocomplete is the easy part of AI in engineering. The whole delivery loop is the hard one: taking a ticket all the way to a merged, reviewed, CI-green pull request without babysitting every step, consistently, and with numbers to back it up.
It takes two pieces working together: a pipeline reliable enough to ship real work, and the tooling to wire agents into the systems where that work lives.
What I did
This is my own pipeline, built independently at Studio110 and running in production at Upmate.
- The full loop. Ticket → low-level design → epic/spec → plan → review → PR → agent code review → CI → merge → follow-up. Each stage is an agent step with a defined contract, so work keeps moving through the pipeline without stalling on a human at every hop.
- Custom MCP servers. I authored Model Context Protocol servers that plug the agents into internal tooling (issue trackers, code-knowledge graphs, delivery systems) so they act on real project state, not guesswork.
- Project conventions as code. The project
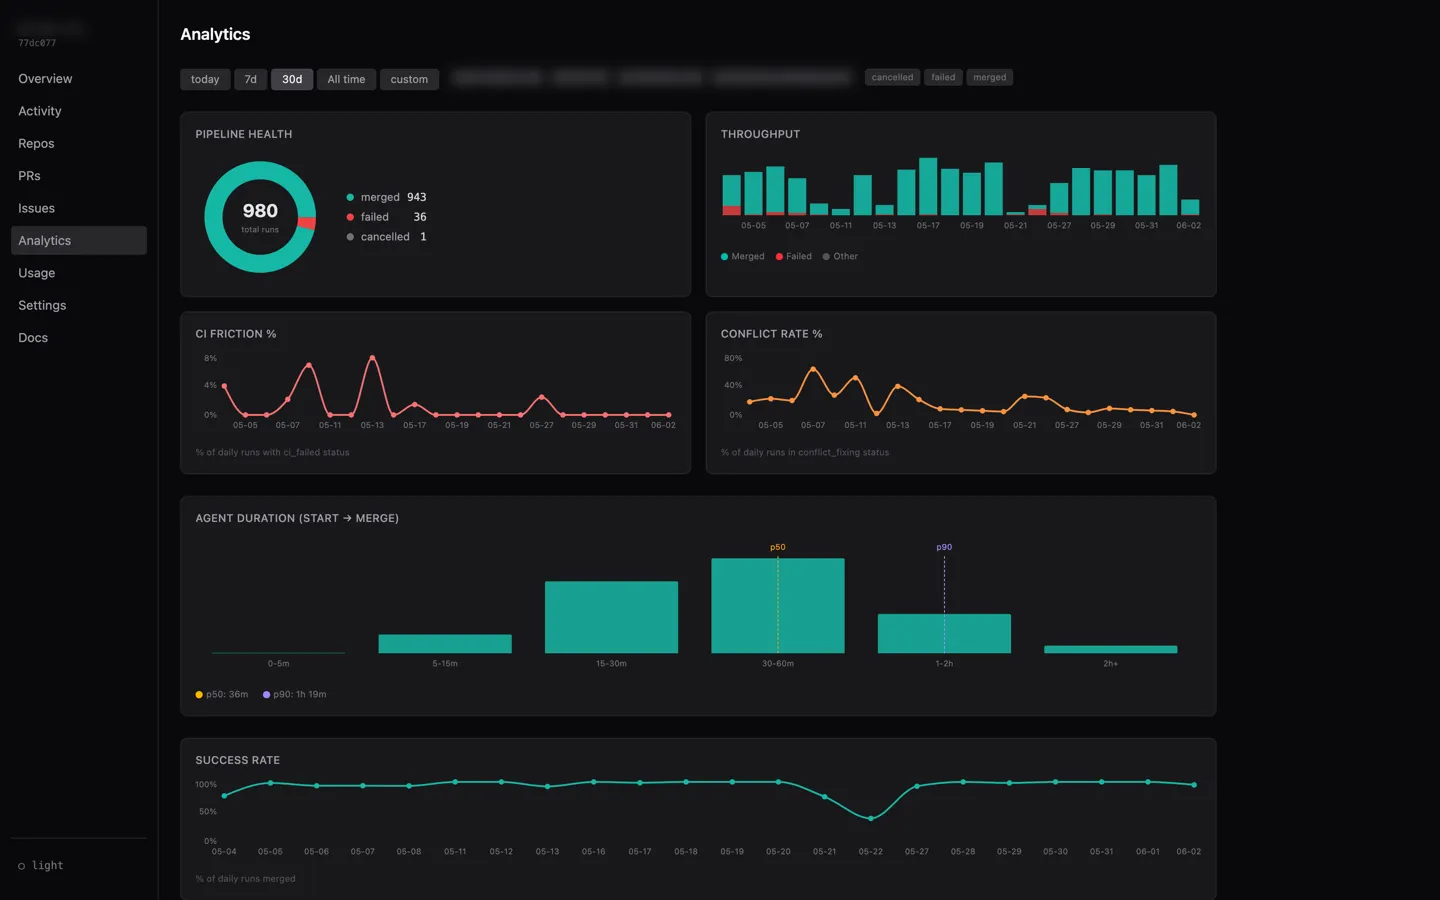
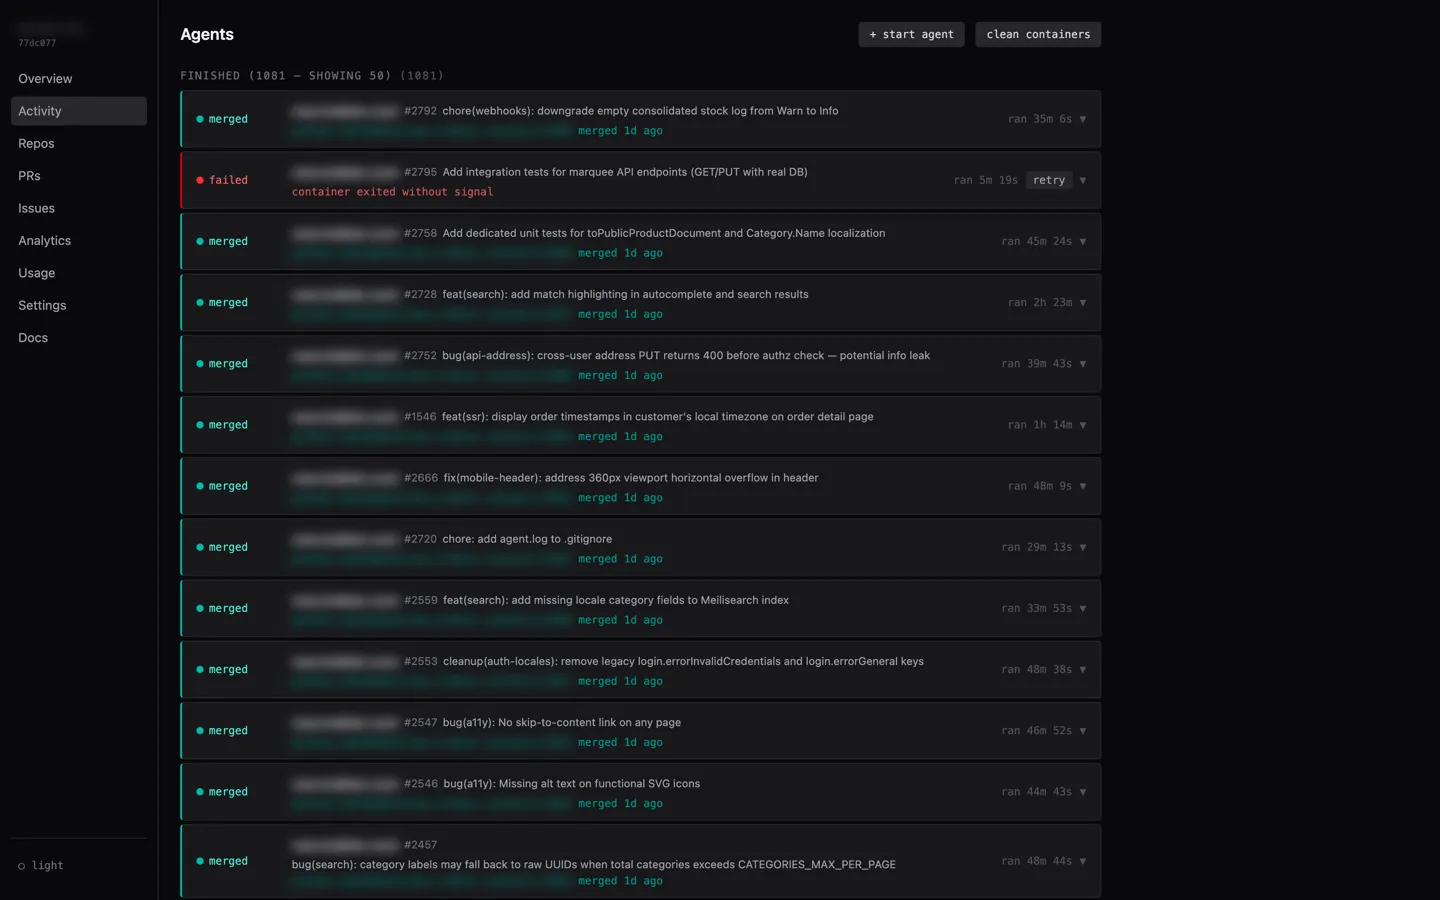
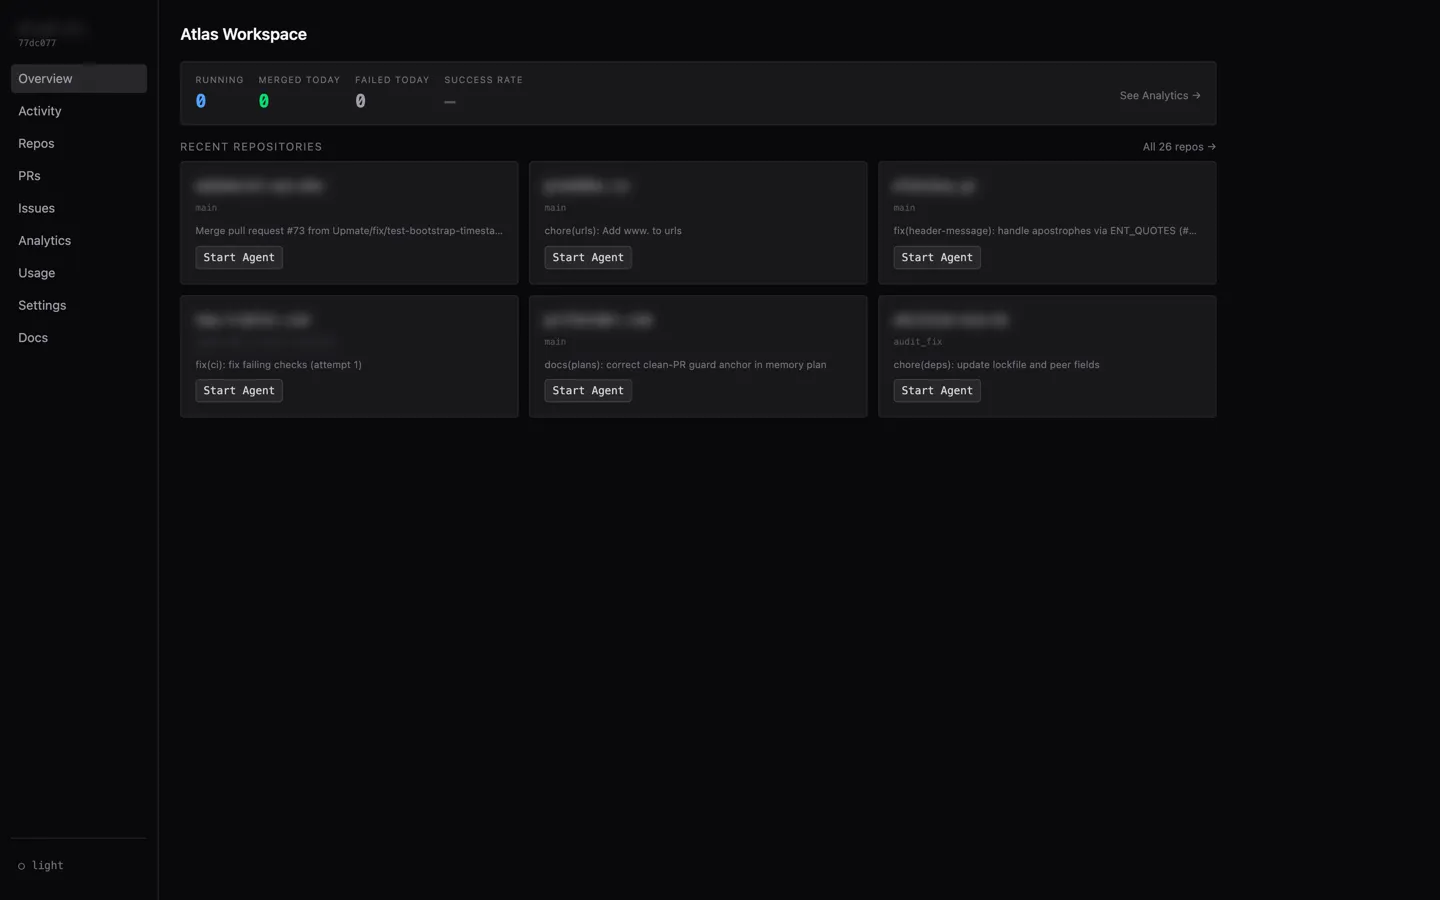
CLAUDE.md, project-specific Claude skills and reusable prompts encode my standards, so every agent run inherits the same architecture, naming and review rules. - Observability. A dashboard tracks every agent run: totals, activity over time, per-project breakdowns. Now the workflow has numbers behind it.
Impact
- 55 tickets to staging in 24 hours on a recent freelance project, via a ~99% agentic workflow.
- 1,300+ agent runs captured on the dashboard across projects, so throughput is measured, not anecdotal.
- A repeatable, measured delivery process I can run solo at the pace of a team.